Home > Statistics > Get Data > Advanced Search Results


RANKING OF COUNTRIES ACCORDING TO LIBERTARIAN DEGREE = DEGREE OF DEMOCRACY - FOR ALMOST ALL COUNTRIES WORLD WIDE.

The System Theory of Anarchist Political Economy and Social Organization Research

THE INTERNATIONAL SOCIAL DEMOCRATIC ALLIANCE
* LIBERAL SOCIAL DEMOCRACY *

PREFACE

Anarchy and anarchism mean "system and management without ruler(s), i.e. co-operation without repression, tyranny and slavery". In short an-arch-y = [(an = without - arch = ruler(s)) - y = system (included optimal order and law) and management, as, say, in monarch-y]. Anarchy and anarchism are efficient and fair system and management without top heavy societal pyramid economical and/or political/administrative - in income and/or rank, i.e. significant horizontal organization - real democracy. Real Democracy always means Real, i.e. including Green, Democracy. Anarchy and anarchism = liberal social-democracy.

NB! Anarchism, the libertarian and democracy, and degrees of this, is 100 % a question of influence on decisions. All other things are only relevant as far as they affects the influence on the societal decisions. To be more precise: anarchism, the libertarian and democracy is a question of influence on the societal decisions by the People = the Bottom of the societal pyramid, the decisions usually and mainly taken by the Top of the societal pyramid, i.e. the Bureacracy (authorities) broadly defined in privat and public sector.

The degree of democracy = influence on the societal decisions by the People = the Bottom of the social pyramid, mainly taken by the Bureaucracy (= authorities broadly defined in private and public sector) - the Top of the social pyramid, measuredrelatively as a percent degree between 0 % and 100 %, that is a precise measure on how much the People govern = democracy, i.e. the degree of it. Democracy, and more or less of it, is central to societal politics broadly defined, both economical and political/administrative, and in reality Real Democracy (NB! i.e. always including Green) and Full Democracy as an ultimate aim, is the one and only policy in the interest of the People, i.e. People's Politics. Real Democracy has a degree of democracy equal to 50 % or more, both A. economical and B. political/administrative, and Full Democracy has 100 % degree of democracy. The degree of democracy = the libertarian degree = the anarchist degree (within anarchy & anarchism), i.e. 100% - the authoritarian degree. Zero, 0 %, influence by the People on the societal decisions, means no tendency of democracy at all, zero degree of democracy, and the most ultra-authoritarian and totalitarian systems (extreme ultra-fascism, see map), i.e. 100% authoritarian = 100% authoritarian degree; the authoritarian degree is 100% - the degree of democracy = libertarian degree, in this 100% ultra-authoritarian case = 0 % degree of democracy = libertarian degree.

Totalitarian systems are all economic-political systems to the left, middle and right of the EP-Map, with more than ca. 67 %, exact 666,666 ... per thousand - authoritarian degree, i.e. ultra-authoritarian hell systems. Typically, the role of 1. propaganda (= lies, untrue information, also Orwellian "1984" Newspeak type lies and manipulations of the language) in dealing with the non-totalitarian world, and the use of 2. terror, are essential to this form of archy/rule/government. Totalitarian regimes seek to dominate every aspect of everyone's life, sometimes as a prelude to try world domination. 1. Cultural, i.e. intellectual, spiritual, and artistic initiative is dangerous to totalitarianism, as 2. mere political opposition. The consistent persecution of every higher form of intellectual activity by the totalitarian rulers springs from 1. their natural resentment against everything they cannot understand, and  2. total domination does not allow for free initiative (an important anarchists principle) in any field of life, for any activity that is not entirely predictable by the ruler(s).

Totalitarianism in power invariably replaces all first-rate talents, regardless of their sympathies, with those crackpots and fools whose lack of intelligence and creativity is still the best guarantee of their loyalty. Important strategic aspects are the use of 1. ultra-authoritarian controlled front organizations, 2. fake governmental agencies, and 3. esoteric false doctrines as 4. a means of concealing the ultra-authoritarian reactionary-radical nature of totalitarian aims and means, from the non-totalitarian world. Individual isolation and loneliness are important preconditions for totalitarian domination. The purpose of all these manipulations broadly defined is to gain economical and political/administrative power including money, as much as possible for the totalitarian ruler(s)/arch(s). [Inspired by Hannah Arendt (1906-1975): The Origins of Totalitarianism.]]

The Anarchist Economic-Politcal Map describes & maps mainly all types of economic-political systems of the world along two dimensions, A. the economical and B. the political/administrative, and sheds light on the authoritarian degree = 100% - the libertarian degree & 100% - the degree of democracy, of the systems in general, including 1. marxism, 2. fascism (including populism) 3. the third alternative (Frisch) - anarchy & anarchism, and 4. liberalism, and 16 different types of systems within these 4 main forms. The map consists of 4 Quadrants, one for each of these four main forms of systems, and 16 Sectors for different types of systems within these four main forms, four Sectors for each Quadrant.

This system theory is also about 1. calculating the societal degree of democracy = libertarian degree = anarchy degree (within the quadrant of anarchism on the map), from A. the degree of economical democracy (socialism vs capitalism defined in terms of influence by the People) and B. the degree of political/administrative democracy (autonomy vs statism defined in terms of influence by the People), and 2. presenting political-econometric indicators for empirical, practical statistical estimation of these variables. The degree of democracy = libertarian degree = 100 % - the authoritarian degree, see the EP-map below. The degree of democracy is 100%, and the authoritarian degree is 0%, at the top of the map, the democratic ideal = full democracy. The degree of democracy is 100% = libertarian degree is 100% = anarchy degreee is 100%, i.e. the democratic ideal, full democracy, is also the libertarian and anarchist ideal, where the People have all and everything to say, equal to 100% influence on the societal decisions by the People, the decisions mainly taken by the Bureaucracy = Top of the societal pyramid.

This system analysis also includes political-econometric research, indicators for A. the degree of economical democracy (socialism vs capitalism defined in terms of influence by the People) and B. the degree of political/administrative democracy (autonomy vs statism defined in terms of influence by the People) aggregated to the societal democracy degree = libertarian degree, for a whole system, say, for a whole country or an organization. There are several political-econometric indicators for practical statistical measurement of influence by the People in democratic perspective, among these are two indexes; 1. the Rank-difference-index - RDI indicating how top-heavy the political/administrative rank-pyramid is, and 2. Gini-index for income, indicating how top-heavy the economical pyramid is. Top-heavyness of a societal pyramid in this connection contributes to less influence by the People it is assumed, but there are also some other indicators in this political-econometric research, see chapter V. B. below.

The research has also, via using the political-econometric indicators combined with the best of the bad lot of UN, other international plus national statistics, and some well educated guess, calculated preliminary estimates of the influence by the People, the Bottom (of the social pyramid), on the societal decisions, mainly taken by the Bureaucracy, the Top (of the pyramid), relatively as a percentage degree between 0 % and 100 %, = the degree of democracy, for almost all of the countries in the world, and also ranked the countries according to democracy degree (= libertarian degree). More information about this topic, including the concrete statistical indicators used, and so on, see chapter V. B. below and footnotes at ranking. NB! Authoritarian degree of more than 100%, i.e. for extreme evil authoritarian economic-political hell systems located below the map, is not impossible, but is just briefly mentioned in this document.

"


*) The stars indicate the position of the Norwegian economical-political system after the revolutionary change in 1994/95.
Fig. 1. Picture of the Anarchist Economical-Political Map

TABLE 1. THE 25 HIGHEST RANKING COUNTRIES ACCORDING TO LIBERTARIAN DEGREE ETC.
THE LIBERTARIAN DEGREE = THE DEGREE OF DEMOCRACY = 100 % - THE AUTHORITARIAN DEGREE

SYSTEM ANALYSIS. DATA FROM 2003-2007.


Countries:

Rank of country according to libertarian degree, and type of system

Libertarian degree and (authoritarian degree) %
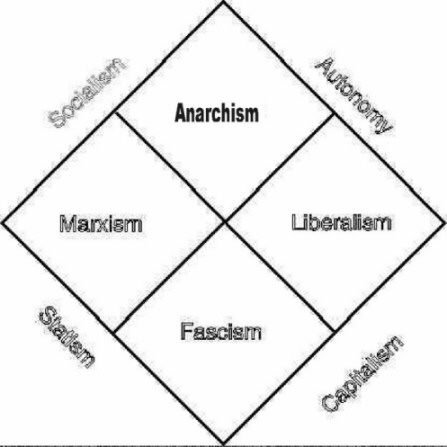
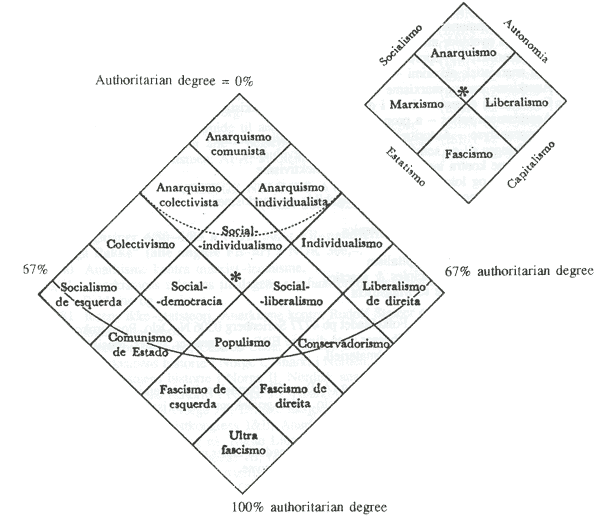
Degree of socialism
and (capitalism) %

Degree of autonomy and
(statism) %

Gini-index

Norway

1 Anarchy

54,0 (46,0)

55,0 (45.0)

53,2 (46,8)

25,8

Switzerland

2 Anarchy

53,0 (47,0)

51,0 (49,0)

55,1 (44,9)

33,1

Iceland

3 Anarchy

52,0 (48,0)

54,0 (46,0)

50,1 (49,9)

25,0 (est.)

Liechtenstein

4 Soc.dem.

49,5 (50,5)

51,4 (48,6)

47,7 (52,3)

32,0 (est.)

Luxembourg

5 Soc.dem.

49,2 (50,8)

52,1 (47,9)

46,5 (53,5)

30,8

Denmark

6 Soc.dem.

48,8 (51,2)

55,3 (44,7)

43,0 (57,0)

24,7

Japan

7 Soc.dem.

48,5 (51,5)

55,2 (44,8)

42,6 (57,4)

24,9

Belgium

8 Soc.dem.

48,2 (51,8)

54,0 (46,0)

43,0 (57,0)

25,0

Finland

9 Soc.dem.

47,9 (52,1)

53,8 (46,2)

42,6 (57,4)

26,9

Sweden

10 Soc.dem.

47,5 (52,5)

54,0 (46,0)

41,7 (58,3)

25,0

Netherlands

11 Soc.dem.

47,2 (52,8)

52,0 (48,0)

42,8 (57,2)

30,9

Canada

12 Soc.dem.

46,8 (53,2)

50,9 (49,1)

43,0 (57,0)

33,1

Austria

13 Soc.dem.

46,5 (53,5)

52,1 (47,9)

41,4 (58,6)

30,0

Ireland

14 Populist

46,2 (53,8)

45,0 (55,0)

47,4 (52,6)

35,9

Germany

15 Soc.dem.

45,9 (54,1)

53,0 (47,0)

39,6 (60,4)

28,3

Spain

16 Soc.dem.

45,5 (54,5)

51,5 (48,5)

40,1 (59,9)

32,5

Australia

17 Populist

45,0 (55,0)

48,0 (52,0)

42,2 (57,8)

35,2

United King.

18 Populist

44,5 (55,5)

44,7 (55,3)

44,3 (55,7)

36.0

New Zealand

19 Populist

44,0 (56,0)

44,6 (55,4)

42,4 (57,6)

36,2

France

20 Soc.dem.

43,5 (56,5)

51,4 (48,6)

36,6 (63,4)

32,7

Italy

21 Populist

43,0 (57,0)

44,7 (55,3)

41,3 (58,7)

36,0

USA

22 Cons. lib.

42,5 (57,5)

24,5 (75,5)

69,8 (30,2)

40,8

Israel

23 Populist

42,3 (57,7)

47,8 (52,2)

37,3 (62,7)

35,5

Hong Kong

24 Cons. lib.

42,1 ( 57,9)

22,1 (77,9)

74,8 (25,2)

43,4

Greece

25 Populist

42,0 (58,0)

47,9 (52,1)

36,6 (63,4)

35,4

The estimates are approximately figures. © IIFOR/IJA ISSN 0800 - 0220 2007 and later. Anarchy = here social-individualist anarchism; Soc. dem. = social democrat marxism; Populist = here moderate parliamentarian democratic fascism; Cons. lib. = Conservative liberalism. See economic-political map at System theory and EP-map. Ranking of countries according to libertarian degree, estimates of the libertarian degree in general, and information on methodology, see Ranking and System theory - Chapter V.B.. According to ThesaurusLegend: approximately = (of quantities) imprecise but fairly close to correct. Thus: The estimates are approximately figures = The estimates are imprecise but fairly close to correct figures. We have used " , ", the European standard instead of American/UK standard, i.e. " . " as decimal separator. The term "ca" is an abbreviation for the latin circa, which means about or approximately. A gini index below 35 indicates socialism, and above indicates capitalism.

TABLE 2. RANKING OF COUNTRIES ACCORDING TO LIBERTARIAN DEGREE = DEGREE OF DEMOCRACY - FOR ALMOST ALL COUNTRIES WORLD WIDE.


HDI rank, Libertarian degree (rank, highest =1)*


Human development index
(HDI) value


 2003

Life expectancy at birth
(years) (HDI)


 2003 a

Adult literacy rate
(% ages 15 and above)


 1990 b

 2003 b

GDP per capita
(US$)


 2003

GDP per capita
(PPP US$)


 2003

Inequality measures - Gini index


  c


World


0.741


67.1


   ..   

   ..   


5,801


8,229


   ..   

High Human Development


1

Norway  1 (ca 54%)


0.963


79.4


   ..   

   ..   


48,412


37,670


25.8

2

Iceland  3 (ca 52%)


0.956


80.7


   ..   

   ..   


36,377


31,243


   ..   

3

Australia 17 (ca 45%)


0.955


80.3


   ..   

   ..   


26,275


29,632


35.2

4

Luxembourg 5 (ca 49,2%)


0.949


78.5


   ..   

   ..   


59,143


62,298


  30.8 p

5

Canada 12 (ca 46,8%)


0.949


80.0


   ..   

   ..   


27,079


30,677


33.1


6

Sweden 10 (ca 47,5%)


0.949


80.2


   ..   

   ..   


33,676


26,750


25.0

7

Switzerland 2 (ca 53%)


0.947


80.5


   ..   

   ..   


43,553


30,552


33.1

8

Ireland 14 (ca 46,2%)


0.946


77.7


   ..   

   ..   


38,487


37,738


35.9

9

Belgium 8 (ca 48,2%)


0.945


78.9


   ..   

   ..   


29,096


28,335


25.0

10

United States 22 (ca 42,5%)


0.944


77.4


   ..   

   ..   


37,648


37,562


40.8


11

Japan 7 (ca 48,5%)


0.943


82.0


   ..   

   ..   


33,713


27,967


24.9

12

Netherlands 11 (ca 47,2%)


0.943


78.4


   ..   

   ..   


31,532


29,371


30.9

13

Finland 9 (ca  47,9%)


0.941


78.5


   ..   

   ..   


31,058


27,619


26.9

14

Denmark 6 (ca 48,8%)


0.941


77.2


   ..   

   ..   


39,332


31,465


24.7

15

United King. 18 (ca 44,5%)


0.939


78.4


   ..   

   ..   


30,253


27,147


36.0


16

France 20 (ca 43,5%)


0.938


79.5


   ..   

   ..   


29,410


27,677


32.7

17

Austria 13 (ca 46,5%)


0.936


79.0


   ..   

   ..   


31,289


30,094


30.0

18

Italy 21 (ca 43%)


0.934


80.1


97.7

   ..   


25,471


27,119


36.0

19

New Zealand 19 (ca 44%)


0.933


79.1


   ..   

   ..   


19,847


22,582


36.2

20

Germany 15 (ca 45,9%)


0.930


78.7


   ..   

   ..   


29,115


27,756


28.3


21

Spain 16 (ca 45,5%)


0.928


79.5


96.3

   ..   


20,404


22,391


32.5

22

Hong Kong, 24  (ca 42,1%)


0.916


81.6


   ..   

   ..   


22,987


27,179


43.4

23

Israel 23 (ca 42, 3%)


0.915


79.7


91.4

96.9


16,481


20,033


35.5

24

Greece 25 (ca 42%)


0.912


78.3


94.9

91.0


15,608


19,954


35.4

25

Singapore 26 (ca 41,8%)


0.907


78.7


88.8

92.5


21,492


24,481


42.5


26

Slovenia 28 (ca 41,5%)


0.904


76.4


99.6

99.7d


13,909


19,150


28.4

27

Portugal 34 (ca 39,3%)


0.904


77.2


87.2

   ..   


14,161


18,126


38.5

28

Korea, Rep. of 29 (ca 41,2%)


0.901


77.0


   ..   

   ..   


12,634


17,971


31.6

29

Cyprus 32 (ca 39,6%)


0.891


78.6


94.3

96.8


14,786


18,776e


   ..   

30

Barbados 33 (ca 39,4%)


0.878


75.0


99.4

99.7d


9,708


15,720


   ..   


31

Czech Republic 27 (ca 41,6%)


0.874


75.6


   ..   

   ..   


8,794


16,357


25.4

32

Malta 31 (ca 39,8%)


0.867


78.4


88.4

87.9f


12,157


17,633


   ..   

33

Brunei 35 (ca 39,2%)


0.866


76.4


85.5

92.7


   ..   


   ..   


   ..   

34

Argentina 45  (ca 37,8%)


0.863


74.5


95.7

97.2


3,524


12,106


52.2

35

Hungary 30 (ca 40%)


0.862


72.7


99.1

99.3


8,169


14,584


26.9


36

Poland 43 (ca 38,1%)


0.858


74.3


99.6

   ..   


5,487


11,379


34.1

37

Chile 46 (ca 37,6%)


0.854


77.9


94.0

95.7


4,591


10,274


57.1

38

Estonia 41 (ca 38,4%)


0.853


71.3


99.8

99.8


6,713


13,539


37.2

39

Lithuania 40 (ca 38,5%)


0.852


72.3


99.3

99.6


5,274


11,702


31.9

40

Qatar 47 (ca 37,5%)


0.849


72.8


77.0

89.2f


31,558q


   27,664q   


   ..   


41

Emirates 48 (ca 37,4%)


0.849


78.0


71.0

77.3d


   .. g


   ..   


   ..   

42

Slovakia 36 (ca 39,1%)


0.849


74.0


   ..   

99.6


6,033


13,494


25.8

43

Bahrain 49 (ca 37,3%)


0.846


74.3


82.1

87.7


   .. g


17,479g


   ..   

44

Kuwait  50 (ca 37,2%)


0.844


76.9


76.7

82.9d


17,421


18,047h


   ..   

45

Croatia 39 (ca 38,6%)


0.841


75.0


96.9

98.1


6,479


11,080


29.0


46

Uruguay 51 (ca 37,1%)


0.840


75.4


96.5

97.7d


3,308


8,280


44.6

47

Costa Rica 52 (ca 37%)


0.838


78.2


93.9

95.8d


4,352


9,606h


46.5

48

Latvia 42 (ca 38,3%)


0.836


71.6


99.8

99.7


4,771


10,270


33.6

49

St. Kitts/Nevis 57 (ca 36,1%)


0.834


70.0i,j,k


   ..   

   ..   


7,397


12,404


   ..   

50

Bahamas 44 (ca 38%)


0.832


69.7


   ..   

   ..   


16,571


17,159g


   ..   


51

Seychelles 53 (ca 36,9%)


0.821


72.7i,k


   ..   

91.9


8,610


   ..   


   ..   

52

Cuba 65 (ca 32,9%)


0.817


77.3


95.1

96.9d


 3,548 q


    4,100 q   


   ..   

53

Mexico 58  (ca 35,7%)


0.814


75.1


87.3

90.3


6,121


9,168


54.6

54

Tonga 66 (ca 32,7%)


0.810


72.2


   ..   

98.9f


1,603


6,992h


   ..   

55

Bulgaria 54 (ca 36,8%)


0.808


72.2


97.2

98.2


2,539


7,731


31.9


56

Panama 67 (ca 32,6%)


0.804


74.8


89.0

91.9


4,319


6,854


56.4

57

Trinidad/Tob. 61 (ca 34,5%)


0.801


69.9


96.8

98.5d


8,007


10,766


40.3

Medium Human Development


58

Libya 68 (ca 32,5%)


0.799


73.6


68.1

81.7d


   .. g


   ..   


   ..   

59

Macedonia 55 (36,7%)


0.797


73.8


   ..   

96.1


2,277


6,794


28.2

60

Antigua/Bar. 59 (ca 35,3%)


0.797


73.9i,j,k


   ..   

   ..   


9,629


10,294


   ..   

61

Malaysia 62 (ca 34,1%)


0.796


73.2


80.7

88.7


4,187


9,512


49.2

62

Russia 56 (ca 36,5 %)


0.795


65.3


99.2

99.4


3,018


9,230


31.0


63

Brazil 69 (ca 32,4%)


0.792


70.5


82.0

88.4


2,788


7,790


59.3

64

Romania 60 (ca 34,9%)


0.792


71.3


97.1

97.3


2,619


7,277


30.3

65

Mauritius 64 (ca 33,5%)


0.791


72.2


79.8

84.3


4,274


11,287


            37.0 q  

66

Grenada 70 (ca 32,3%)


0.787


65.3l,k


   ..   

   ..   


4,199


7,959


   ..   

67

Belarus 71 (ca 32,2%


0.786


68.1


99.5

99.6f


1,770


6,052


30.4


68

Bosnia/Herz. 63 (ca 33,7%)


0.786


74.2


   ..   

94.6


1,684


5,967


26.2

69

Colombia 72 (ca 32,1%)


0.785


72.4


88.4

94.2


1,764


6,702h


57.6

70

Dominica 73 (ca 32%)


0.783


75.6l,k


   ..   

   ..   


3,639


5,448


   ..   

71

Oman 74 (ca 31,9%)


0.781


74.1


54.7

74.4d


   .. g


13,584g


   ..   

72

Albania 75 (ca 31,8%)


0.780


73.8


77.0

98.7


1,933


4,584


28.2


73

Thailand 78 (ca 31,5%)


0.778


70.0


92.4

92.6


2,305


7,595


43.2

74

Samoa W. 79 (ca 31,4%)


0.776


70.2


98.0

98.7d


1,505


5,854h


   ..   

75

Venezuela 80 (ca 31,3%)


0.772


72.9


88.9

93.0


3,326


4,919


49.1

76

Saint Lucia 81 (ca 31,2%)


0.772


72.4


   ..   

90.1


4,314


5,709


   ..   

77

Saudi Arabia 82  (ca 31,1%)


0.772


71.8


66.2

79.4


9,532


13,226h


   ..   


78

Ukraine 76 (ca 31,7%)


0.766


66.1


99.4

99.4


1,024


5,491


29.0

79

Peru 83 (ca 31%)


0.762


70.0


85.5

87.7


2,231


5,260


49.8

80

Kazakhstan 77 (ca 31,6%)


0.761


63.2


98.8

99.5f


2,000


6,671


32.3

81

Lebanon 84 (ca 30,9%)


0.759


72.0


80.3

   ..   


4,224


5,074


   ..   

82

Ecuador 85 (ca 30,8%)


0.759


74.3


87.6

91.0


2,091


3,641


43.7


83

Armenia 86 (ca 30,7%)


0.759


71.5


97.5

99.4


 918 


3,671


37.9

84

Philippines 87 (ca 30,6%)


0.758


70.4


91.7

92.6


 989 


4,321


46.1

85

China 88 (ca 30,5%)


0.755


71.6


78.3

90.9


1,100


5,003m


44.7

86

Suriname 89 (ca 30,4%)


0.755


69.1


   ..   

88.0


2,635


   ..   


   ..   

87

St  Vincent/Gre.90(ca 30,3%)


0.755


71.1


   ..   

   ..   


3,403


6,123


   ..   


88

Paraguay 91 (ca 30,2%)


0.755


71.0


90.3

91.6


1,069


4,684h


57.8

89

Tunisia 92 (ca 30,1%)


0.753


73.3


59.1

74.3


2,530


7,161


39.8

90

Jordan 93  (ca 30%)


0.753


71.3


81.5

89.9


1,858


4,320


36.4

91

Belize 94 (ca 29,9%)


0.753


71.9


89.1

76.9


3,612


6,950


   ..   

92

Fiji 95 (ca 29,8)


0.752


67.8


88.6

92.9f


2,438


5,880


   ..   


93

Sri Lanka 96 (ca 29,7%)


0.751


74.0


88.7

90.4n


 948 


3,778


33.2

94

Turkey 97 (ca 29,6%)


0.750


68.7


77.9

88.3


3,399


6,772


40.0

95

Dominican Rep.98(ca 29,4%)


0.749


67.2


79.4

87.7


1,893


6,823h


47.4

96

Maldives 99 (ca 29,2%)


0.745


66.6


94.8

97.2d


2,441


   ..   


   ..   

97

Turkmenistan 104 (ca 28,6%)


0.738


62.4


   ..   

98.8f


1,275


5,938


40.8


98

Jamaica 101 (ca 29%)


0.738


70.8


82.2

87.6d


3,083


4,104


37.9

99

Iran 102  (ca 28,9%)


0.736


70.4


63.2

77.0


2,066


6,995


43.0

100

Georgia 103 (ca 28,7%)


0.732


70.5


   ..   

   ..   


 778 


2,588


   40.4 p

101

Azerbaijan 112 (ca 27,8%)


0.729


66.9


   ..   

98.8f


 867 


3,617


36.5

102

Occupied Palestinian Territories. 110 (ca 28%)


0.729


72.5


   ..   

91.9


1,026


   ..   


   ..   


103

Algeria 105 (ca 28,5%)


0.722


71.1


52.9

69.8


2,090


6,107h


35.3

104

El Salvador 106 (ca 28,4%)


0.722


70.9


72.4

79.7d


2,277


4,781h


53.2

105

Cape Verde 107 (ca 28,3%)


0.721


70.4


63.8

75.7d


1,698


5,214h


   ..   

106

Syria 108 (ca 28,2%)


0.721


73.3


64.8

82.9


1,237


3,576


   ..   

107

Guyana 109 (ca 28,1%)


0.720


63.1


97.2

   ..   


 965 


4,230h


   ..   


108

Viet Nam 111 (ca 27,9%)


0.704


70.5


90.4

90.3f


 482 


2,490


37.0

109

Kyrgyzstan 100 (ca 29,1%)


0.702


66.8


   ..   

98.7f


 378 


1,751


34.8

110

Indonesia 113 (ca 27,7%)


0.697


66.8


79.5

87.9d


 970 


3,361


34.3

111

Uzbekistan 114 (ca 27,6%)


0.694


66.5


98.7

99.3d


 389 


1,744


26.8

112

Nicaragua 115 (ca 27,5%)


0.690


69.7


62.7

76.7


 745 


3,262h


43.1


113

Bolivia 116 (ca 27,4%)


0.687


64.1


78.1

86.5


 892 


2,587


44.7

114

Mongolia 117 (ca 27,3%)


0.679


64.0


97.8

97.8


 514 


1,850


30.3

115

Moldova 118 (ca 27,2)


0.671


67.7


97.5

96.2


 463 


1,510


36.9

116

Honduras 119 (ca 27,1%)


0.667


67.8


68.1

80.0


1,001


2,665h


55.0

117

Guatemala 120 (ca 27%)


0.663


67.3


61.0

69.1


2,009


4,148h


59.9


118

Vanuatu 121 (ca 26,9%)


0.659


68.6


   ..   

74.0f


1,348


2,944h


   ..   

119

Egypt 122 (ca 26,7%)


0.659


69.8


47.1

55.6f


1,220


3,950


34.4

120

South Africa 123 (ca 26,5%)


0.658


48.4


81.2

82.4f


3,489


10,346h


57.8

121

Equat. Guinea 124(ca 26,3%)


0.655


43.3


73.3

84.2


5,900


19,780e,h


   ..   

122

Tajikistan 125 (ca 26,1%)


0.652


63.6


98.2

99.5


 246 


1,106


32.6


123

Gabon 126 (ca 26%)


0.635


54.5


   ..   

   ..   


4,505


6,397


   ..   

124

Morocco 127 (ca 25,8%)


0.631


69.7


38.7

50.7d


1,452


4,004


39.5

125

Namibia 128 (ca 25,5%)


0.627


48.3


74.9

85.0


2,120


6,180h


70.7

126

São Tomé etc.129(ca 25,2%)


0.604


63.0


   ..   

   ..   


 378 


   ..   


   ..   

127

India 130 (ca 25%)


0.602


63.3


49.3

61.0n


 564 


2,892h


32.5


128

Solomon Isl. 131 (ca 24,9%)


0.594


62.3


   ..   

   ..   


 553 


1,753h


   ..   

129

Myanmar 132 (ca 24,8%)


0.578


60.2


80.7

89.7


   ..   


   ..   


   ..   

130

Cambodia 133 (ca 24,7%)


0.571


56.2


62.0

73.6


 315 


2,078h


40.4

131

Botswana 134 (ca 24,6%)


0.565


36.3


68.1

78.9d


4,372


8,714


63.0

132

Comoros 135 (ca 24,5%)


0.547


63.2


53.8

56.2d


 538 


1,714 h


   ..   


133

Laos  Rep. 137 (ca 24,3%)


0.545


54.7


56.5

68.7


 375 


1,759


37.0

134

Bhutan 138 (ca 24,2%)


0.536


62.9


   ..   

   ..   


 797 


   ..   


   ..   

135

Pakistan 136 (ca 24,4%)


0.527


63.0


35.4

48.7


 555 


2,097


33.0

136

Nepal 141 (ca 23,9%)


0.526


61.6


30.4

48.6


 237 


1,420


36.7

137

P. N.Guinea 139 (ca 24,1%)


0.523


55.3


56.6

57.3


 578 


2,619 h


50.9


138

Ghana 140 (ca 24%)


0.520


56.8


58.5

54.1


 369 


2,238 h


40.8

139

Bangladesh 142 (ca 23,8%)


0.520


62.8


34.2

41.1d


 376 


1,770


31.8

140

Timor-Leste 143 (ca 23,7%)


0.513


55.5


   ..   

   ..   


 389 


   ..   


     38.0 q

141

Sudan 144 (ca 23,6%)


0.512


56.4


45.8

59.0n


 530 


1,910 h


   ..   

142

Congo 145 (ca 23,5%)


0.512


52.0


67.1

82.8d


 949 


 965 


   ..   


143

Togo 146 (ca 23,4%)


0.512


54.3


44.2

53.0


 362 


1,696 h


   ..   

144

Uganda 147 (ca 23,3%)


0.508


47.3


56.1

68.9d


 249 


1,457 h


43.0

145

Zimbabwe 153 (ca 22,7%)


0.505


36.9


80.7

90.0d


   .. g


2,443 e


56.8

Low Human Development


146

Madagascar 148 (ca 23,2%)


0.499


55.4


58.0

70.6


 324 


 809 


47.5

147

Swaziland 149 (ca 23,1%)


0.498


32.5


71.6

79.2


1,669


4,726


60.9

148

Cameroon 150 (ca 23%)


0.497


45.8


57.9

67.9


 776 


2,118


44.6

149

Lesotho 151 (ca 22,9%)


0.497


36.3


78.0

81.4


 635 


2,561 h


63.2

150

Djibouti 152  (ca 22,8%)


0.495


52.8


   ..   

   ..   


 886 


2,086 h


   ..   


151

Yemen 154 (ca 22,6%)


0.489


60.6


32.7

49.0d


 565 


 889 


33.4

152

Mauritania 155 (ca 22,5%)


0.477


52.7


34.8

51.2


 384 


1,766 h


39.0

153

Haiti 182 (ca 20,25%)


0.475


51.6


39.7

51.9 d


 346 


1,742 h


   ..   

154

Kenya 181 (ca 20,3%)


0.474


47.2


70.8

73.6


 450 


1,037


42.5

155

Gambia 158 (ca 22,2%)


0.470


55.7


   ..   

   ..   


 278 


1,859h


47.5


156

Guinea 159 (ca 22,1%)


0.466


53.7


   ..   

   ..   


 459 


2,097


40.3

157

Senegal 160 (ca 22%)


0.458


55.7


28.4

39.3


 634 


1,648


41.3

158

Nigeria 169 (ca 21,1%)


0.453


43.4


48.7

66.8d


 428 


1,050


50.6

159

Rwanda 170 (ca 21%)


0.450


43.9


53.3

64.0


 195 


1,268h


28.9

160

Angola 163 (ca 21,7%)


0.445


40.8


   ..   

66.8


 975 


2,344h


   ..   


161

Eritrea 164 (ca 21,6%)


0.444


53.8


   ..   

   ..   


 171 


 849h


   ..   

162

Benin 165 (ca 21,5%)


0.431


54.0


26.4

33.6


 517 


1,115


   ..   

163

Côte d'Ivoire 166(ca 21,4%)


0.420


45.9


38.5

48.1


 816 


1,476


44.6

164

Tanzania 167 (ca 21,3%)


0.418


46.0


62.9

69.4


 287 


 621 


38.2

165

Malawi 168 (ca 21,2%)


0.404


39.7


51.8

64.1 f


 156 


 605 


50.3


166

Zambia 171 (ca 20,95%)


0.394


37.5


68.2

67.9 f


 417 


 877 


52.6

167

Congo172 (ca 20,9%)


0.385


43.1


47.5

65.3


 107 


   ..   


   ..   

168

Mozambique 161 (ca 21,9%)


0.379


41.9


33.5

46.5 d


 230 


1,117 h


39.6

169

Burundi 173 (ca 20,85%)


0.378


43.6


37.0

58.9


  83 


 648 h


33.3

170

Ethiopia 162 (ca 21,8%)


0.367


47.6


28.6

41.5 d


  97 


 711 h


30.0


171

Central A.R. 176 (ca 20,6%)


0.355


39.3


33.2

48.6


 309 


1,089 h


61.3

172

Guinea-Bis. 163 (ca 21,7%)


0.348


44.7


   ..   

   ..   


 160 


 711 h


47.0

173

Chad 174 ( ca 21,5%)


0.341


43.6


27.7

25.5


 304 


1,210 h


   ..   

174

Mali 175 (ca 20,7%)


0.333


47.9


18.8

19.0 f


 371 


 994 


50.5

175

Burkina Faso 167(ca 21,3%)


0.317


47.5


   ..   

12.8 f


 345 


1,174 h


48.2


176

Sierra Leone 168 (ca 21,2%)


0.298


40.8


   ..   

29.6


 149 


 548 


62.9

177

Niger 169 (ca 21,1%)


0.281


44.4


11.4

14.4


 232 


 835 h


50.5

Without HDI Rank


Afghanistan 170 (ca 21,0%)


   ..   


43.8 q


28.1 q   

   ..   


  327 q   


 800 q  


   ..   


Andorra (same as Spain)


   ..   


   ..   


   ..   

   ..   


   ..   


   ..   


   ..   


Iraq 177 (ca 20,5%)


   ..   


58.9


35.7

   ..   


879  o


1,900 o  


   ..   


Kiribati 178 (ca 20,45%)


   ..   


   ..   


   ..   

   ..   


 567 


   ..   


   ..   


Korea N. 179 (ca 20,4%)


   ..   


63.1


   ..   

   ..   


   ..   


   ..   


   ..   


Liberia 180 (ca 20,35%)


   ..   


42.4


39.2

55.9d


 131 


   ..   


   ..   


Liechtenstein 4 (ca 49,5%)


   ..   


79.8 q


100.0 q 

100.0 q   


  34,810 q   


25,000 q   


   ..   


Marshall I. 157  (ca 22,3%)


   ..   


   ..   


   ..   

   ..   


2,017


   ..   


   ..   


Micronesia 156 (ca 22,4%)


   ..   


67.6


   ..   

   ..   


1,952


   ..   


   ..   


Monaco 37 (ca 38,9%)


   ..   


   ..   


   ..   

   ..   


   ..   


   ..   


   ..   


Nauru 183 (ca 20,2%)


   ..   


   ..   


   ..   

   ..   


   ..   


   ..   


   ..   


Palau 184 (ca 20,15%)


   ..   


   ..   


   ..   

   ..   


6,281


   ..   


   ..   


San Marino 38 (ca 38,7%)


   ..   


   ..   


   ..   

   ..   


   ..   


   ..   


   ..   


Somalia 186 ( ca 20%)


   ..   


46.5


   ..   

   ..   


   ..   


   ..   


   ..   


Tuvalu 185 (ca 20,1%)


   ..   


   ..   


   ..   

   ..   


   ..   


   ..   


   ..   


Serbia and Montenegro (same as Bosnia-Herzegovina


   ..   


73.3


   ..   

96.4


2,558


   ..   


   ..   


Because the underlying household surveys differ in method and in the type of data collected, the distribution data are not strictly comparable across countries.
Notes:
a. The HDI rank is determined using HDI values to the fifth decimal point.
b. Data for 1990 refer to estimates produced by UNESCO Division of Statistics based on data prior to 1990; data for 2003 refer to national literacy estimates from censuses or surveys conducted between 2000 and 2004, unless otherwise noted. Due to differences in methodology and timeliness of underlying data, comparisons across countries and over time should be made with caution. For more details, see http://www.uis.unesco.org/ev.php?ID=4930_201&ID2=DO_TOPIC.
c. A value of 0 represents perfect equality, and a value of 100 perfect inequality.
d. Estimate produced by UNESCO Institute for Statistics in July 2002.
e. Data refer to 2001.
f. Data refer to a year between 1995 and 1999.
g. Data refer to 2002.
h. Estimates are based on regression.
i. Data are from national sources.
j. Data are from the Secretariat of the Organization of Eastern Caribbean States, based on national sources.
k. Data refer to year other than that specified
l. Data are from the Secretariat of the Caribbean Community, based on national sources.
m. Estimate based on a bilateral comparison between China and the United States (Ruoen, Ren and Chen Kai. 1995. "China's GDP in US Dollars Based on Purchasing Power Parity." World Bank Policy Research Working Paper No. 1415. Washington, D.C.).
n. Data refer to a year or period other than that specified, differ from the standard definition or refer to only part of a country.

o. 2006 estimates.

p. Data are from Earth Trends ISO 1989-2004

q. Gini-indexes: Estimate from 1987 for Mauritius. Estimate from 2002 for Timor-Leste. Cuba’s GDP-per capita 2006 estimate. Liechtenstein: Life expectancy of birth 2007 estimate. GDP per capita 1999 estimates. Afghanistan: Life exp. 2007 estimate, literacy 2000 estimate, GDP per capita 2006 estimate and GDP ppp per capita 2004 estimate. Source CIA: The World Factbook. Qatar: GDP per capita 2005 estimate and GDP ppp per capita 2005 estimate. Source UN HDI-statistics based on data from 2005.

*)  Accounting for economic and political/administrative freedom, solidarity, and equality etc. also democracy vs. totalitarian systems, i.e. mostly dictatorship, heavy ochlarchy or extreme capitalist liberalism. The gini-index measures how top heavy the income hierarchy is. If one has all of the income the index is 100. This is the most top heavy income hierarchy. If everybody has the same income, no hierarchy - the distribution is flat - the index is zero. As a rule of the thumb a gini-index less than 35 indicates socialism, and an index more than 35 indicates capitalism - economical plutarchy. This is only a rule of the thumb, the concept of socialism also includes efficiency. Thus a system with high efficiency, a large GDP per capita, and a gini-index at 30 may be more socialist than a system with low GDP per capita and a gini-index at 25. Socialism means a lot of wealth plus a reasonable flat distribution of income. The libertarian degree is dependent on the degree of socialism and the degree of autonomy, see http://www.anarchy.no/formula.html . The ranking and point estimates are made by IIFOR, see http://www.anarchy.no/iifor.html . IIFOR has published point estimates of the libertarian degree for all of the countries mentioned in the HDI-statistics of the UN, also the countries without HDI rank. The estimates of the libertarian degree for countries ranked from 101-186 are between ca 29%-20%. The ranking of countries from 101-186 is very uncertain. Also the estimates for the 100 most libertarian countries are a bit uncertain. Countries with less than 33,33% libertarian degree, i.e. more than 666 per thousand authoritarian degree are totalitarian, i.e. either dictatorships, heavy ochlarchies (ochlarchy = mob rule broadly defined), say, with rivaling polyarchy or oligarchy, or have a very low degree of autonomy and/or socialism in general. The countries ranked from no 65-186 according to libertarian degree, have less than 33,33% libertarian degree, and are thus very authoritarian, i.e. totalitarian. On the other end of the ranking we have three anarchies of low degree, no 1 Norway with ca 54% anarchy degree, no 2 Switzerland with ca 53% degree of anarchy and no 3, Iceland with ca 52% degree of anarchy. These societies are real democratic, the systems work significantly more from the bottom, grassroots, and upwards, than from the top downwards to the bottom. Thus it is anarchism. Anarchies have more than 50% anarchy degree, i.e. significant. The countries in the middle, ranked from 4-64 according to libertarian degree, are semi-democratic, the systems work more from the top downwards to the bottom, than from the bottom, grassroots, and upwards, but they are not totalitarian. They have a libertarian degree between ca 49,99% - 33,32%. These countries mostly are parliamentarian democracies. The investigation is based on the UN-statistics above, OECD statistics, EUROSTAT, statistics from the Statistisk Sentralbyrå in Norway, and several other sources. In the column for the libertarian degree we have used “,”, the European standard instead of American/UK standard, i.e. “.” as decimal separator. The term “ca” is an abbreviation for the latin circa, which means about or approximately. Some more detailed research results are presented at http://www.anarchy.no/andebate.html for discussion.

Source:
column 1: calculated on the basis of data in columns 6-8 of table 1 (HDR 2005); see technical note 1 for details.
column 2: UN (United Nations). 2005. Correspondence on life expectancy at birth. Department of Economic and Social Affairs, Population Division. New York, unless otherwise noted.
column 3: UNESCO Institute for Statistics (United Nations Educational, Scientific and Cultural Organization). 2003. Correspondence on adult and youth literacy rates. April. Montreal.
column 4: UNESCO Institute for Statistics (United Nations Educational, Scientific and Cultural Organization). 2005. Correspondence on adult and youth literacy rates. April. Montreal.
column 5: calculated on the basis of GDP and population data from World Bank. 2005. World Development Indicators 2005. CD-ROM. Washington, DC.; aggregates calculated for the Human Development Report Office by the World Bank.
column 6: calculated on the basis of GDP and population data from World Bank. 2005. World Development Indicators 2005. CD-ROM. Washington, DC.; aggregates calculated for the Human Development Report Office by the World Bank.
column 7: World Bank. 2005. Correspondence on income distribution data. Washington, D.C. April.